After recently completing the Data Science and Machine Learning with R from A-Z course on Udemy, I was eager to put the frameworks I learned into practice. I chose the field of clinical health prediction because it demands “high accuracy” as well as a deep understanding of data preprocessing and model interpretation.
The Data: A Multi-Center Study
For this analysis, I used the UCI Heart Disease Dataset sourced from Kaggle. This specific version contains 920 records pooled from four clinical locations: Cleveland, Hungary, Switzerland, and Long Beach.
This dataset contained missing values (NAs) in critical measurements like cholesterol and blood pressure. Instead of simply deleting these rows, I utilized the recipes package in R (part of the tidymodels framework) to perform median and mode Imputation, ensuring the model could learn from the entire dataset without losing valuable information.
Methodology: Using tidymodels
In clinical settings, the cost of a False Negative (missing a sick patient) is far higher than a False Positive. To build a model that balances these risks, I moved away from “base R” scripts toward a professional pipeline using the tidymodels approach.
- Data Splitting: Using the
rsamplepackage, I created an 80/20 train/test split. This ensures the model is tested on data it has never seen before, mimicking a real-world clinical evaluation. - Feature Engineering: With the
recipespackage, I normalized all numeric predictors so that variables with larger ranges (like heart rate) wouldn’t overshadow smaller, equally important metrics (like ST depression). - Model Selection: I chose Logistic Regression. In healthcare, “Black Box” models are often less preferred; Logistic Regression provides “Odds Ratios,” offering the transparency that clinicians need to trust a model’s output.
The Technical Implementation (R)
#Load necessary libraries
library(tidymodels)
library(tidyverse)

#Load and prepare data
heart_data <- read_csv("C:/Users/USER/Downloads/heart_disease_uci.csv") %>%
#Change 'num' column (0-4 severity scale) to binary 'target' (healthy vs. disease)
  mutate(target = if_else(num > 0, "disease", "healthy"),
         target = as.factor(target)) %>%
#Remove identifiers and location columns to focus on clinical features
  select(-id, -dataset, -num)

#Split the data into training and testing sets (80% Training, 20% Testing) using rsample package in tidymodels framework
set.seed(123) #This is for repeatable random splits
data_split <- initial_split(heart_data, prop = 0.80, strata = target)
data_train <- training(data_split)
data_test  <- testing(data_split)

#Data preprocessing using the recipe package wthin the tidymodels
#Handling missing data (Imputation) and scaling
data_recipe <- recipe(target ~ ., data = data_train) %>%
  step_impute_median(all_numeric_predictors()) %>% #fills missing numbers
  step_impute_mode(all_nominal_predictors())   %>% #fills missing categories
  step_normalize(all_numeric_predictors())     %>% #scales values
  step_dummy(all_nominal_predictors())           #converts text to binary 0/1

#Logistic Regression Model
lr_model <- logistic_reg() %>%
  set_engine("glm") %>%
  set_mode("classification")

#Put the model into a workflow and train
heart_workflow <- workflow() %>%
  add_recipe(data_recipe) %>%
  add_model(lr_model)

heart_fit <- heart_workflow %>%
  fit(data = data_train)

#Evaluate the model using a confusion matrix
heart_results <- data_test %>%
  select(target) %>%
  bind_cols(predict(heart_fit, new_data = data_test))

heart_cm <- heart_results %>%
  conf_mat(truth = target, estimate = .pred_class)

#Plotting the results
autoplot(heart_cm, type = "heatmap") +
  scale_fill_gradient(low = "#f7fbff", high = "#08306b") +
  labs(title = "Confusion Matrix: UCI Multi-Center Study",
       subtitle = "Model evaluation on unseen clinical data")

#To save the confusion matrix plot as a PNG
ggsave("heart_disease_cm.png",
       width = 7,
       height = 5,
       dpi = 300)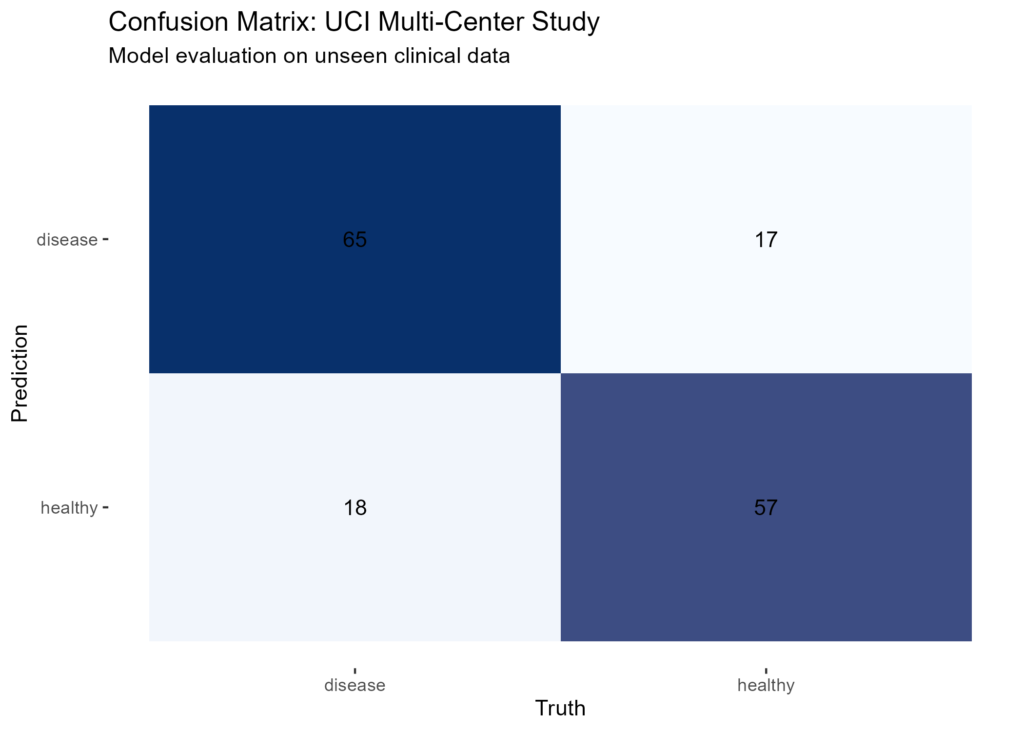
Results and Impact
To evaluate the model, I generated a confusion matrix. In medical data science, focusing on sensitivity, which measures how well the model identifies patients who actually have the condition.
By using the recipes package to handle missing data and scale the features, the model remained both interpretable and reliable. This project shows how a structured workflow can turn raw clinical measurements into a predictive tool for decision-making.
Data Source: Kaggle / UCI Heart Disease Dataset
Key Packages: tidymodels(recipes, rsample, ggplot2)
Leave a Reply