Tools: R • dplyr • ggplot2 • lubridate • K-Means Clustering • Customer Analytics
Project Overview
Customers differ considerably in how recently they purchased, how often they return, and how much they spend. Treating every customer the same can therefore lead to ineffective marketing and missed retention opportunities.
In this project, I analyzed 541,909 online retail transaction records collected between December 2010 and December 2011. I used the Recency–Frequency–Monetary framework, commonly known as RFM analysis, to summarize customer purchasing behavior and group customers into meaningful segments.
The project involved data cleaning, exploratory analysis, customer-level feature engineering, data transformation, K-means clustering, and interpretation of the resulting customer groups.
Business Questions
The analysis was designed to answer four questions:
- How did sales change during 2011?
- Which customers purchased most recently and frequently?
- Which customers generated the highest revenue?
- Can customers be grouped into segments that support targeted marketing decisions?
Project Repository
The complete R analysis script, project figures, and documentation are available on GitHub.
Data Preparation
Several preprocessing steps were completed before calculating customer metrics.
I removed records without customer IDs because those purchases could not be connected to individual customers. Invoice dates were converted into date-time format, and cancelled invoices were identified using invoice numbers beginning with C.
For the customer segmentation analysis, I kept completed purchases with positive quantities and unit prices. Transaction revenue was calculated as:
Revenue = Quantity × Unit Price
This prevented returns, cancellations, and invalid transactions from inflating or reducing customer value.
Sales Performance During 2011
Monthly revenue generally increased as the year progressed and reached its highest level in November. This indicates strong sales activity leading up to the holiday shopping period.
December appears substantially lower because the dataset ends on December 9 and therefore does not represent a complete month.
Figure 1. Monthly Revenue in 2011
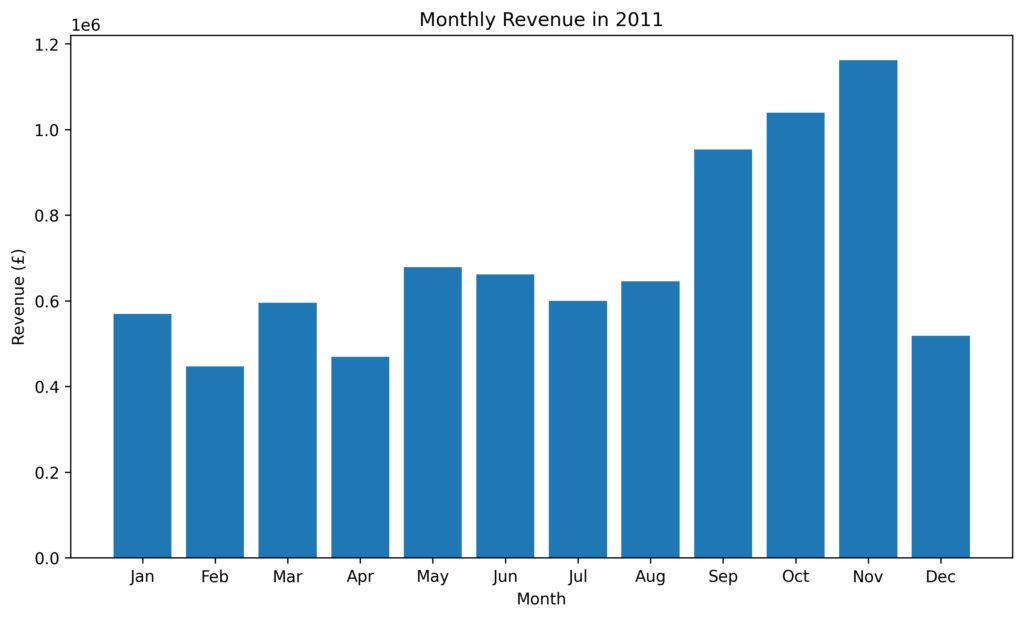
Monthly revenue increased toward the end of 2011 and peaked in November. December includes only the first nine days of the month.
Building the RFM Customer Metrics
Customer purchasing behavior was summarized using three measures.
Recency
Recency is the number of days between a customer’s most recent purchase and the dataset’s final date. A lower recency value indicates that the customer purchased more recently.
Frequency
Frequency represents the number of unique completed invoices associated with each customer. Customers with higher frequency values purchased from the retailer more often.
Monetary Value
Monetary value represents the total revenue generated by each customer across all completed purchases.
The RFM variables were strongly right-skewed because most customers purchased infrequently and spent relatively modest amounts, while a smaller group purchased repeatedly and generated very high revenue.
To reduce the influence of extreme values, I applied a log(x + 1) transformation to each RFM variable. I then used min–max scaling so that recency, frequency, and monetary value contributed on comparable scales during clustering.
Selecting the Number of Customer Segments
I used K-means clustering to group customers with similar RFM characteristics.
To compare possible solutions, I calculated the within-cluster sum of squares for models containing between two and eight clusters. The elbow plot begins to level off around four clusters, indicating that a four-cluster model provided a reasonable balance between simplicity and separation.
Figure 2. Selecting the Number of Clusters
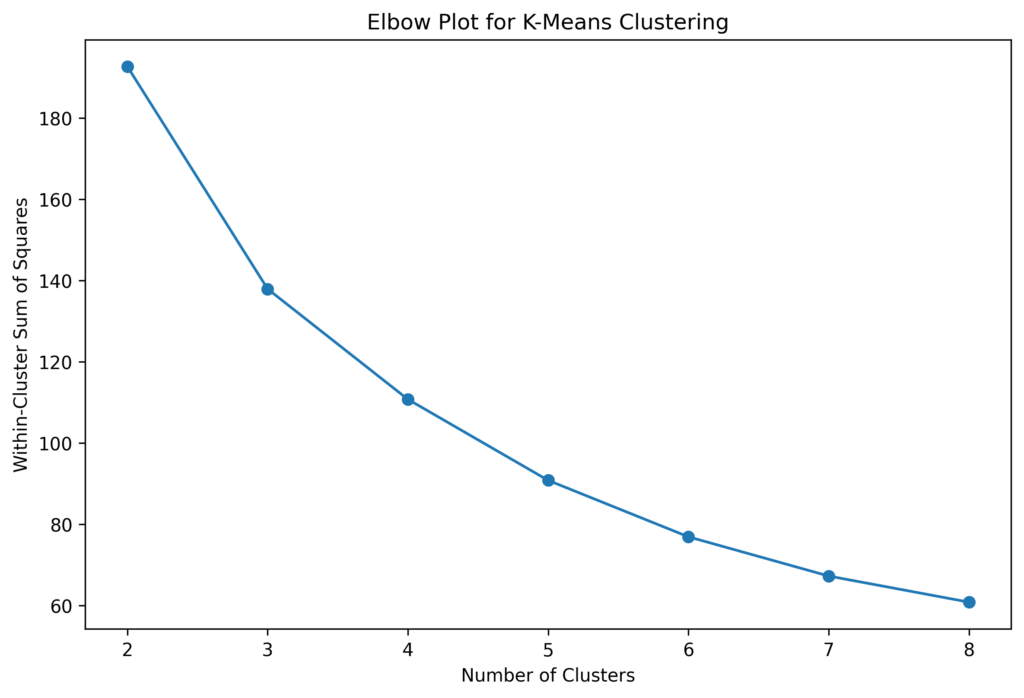
The elbow plot supports the use of four clusters by showing diminishing improvements after the four-cluster solution.
Customer Segmentation Results
The final K-means model identified four groups with distinct purchasing patterns.
| Customer segment | Customers | Average recency | Average frequency | Average monetary value |
|---|---|---|---|---|
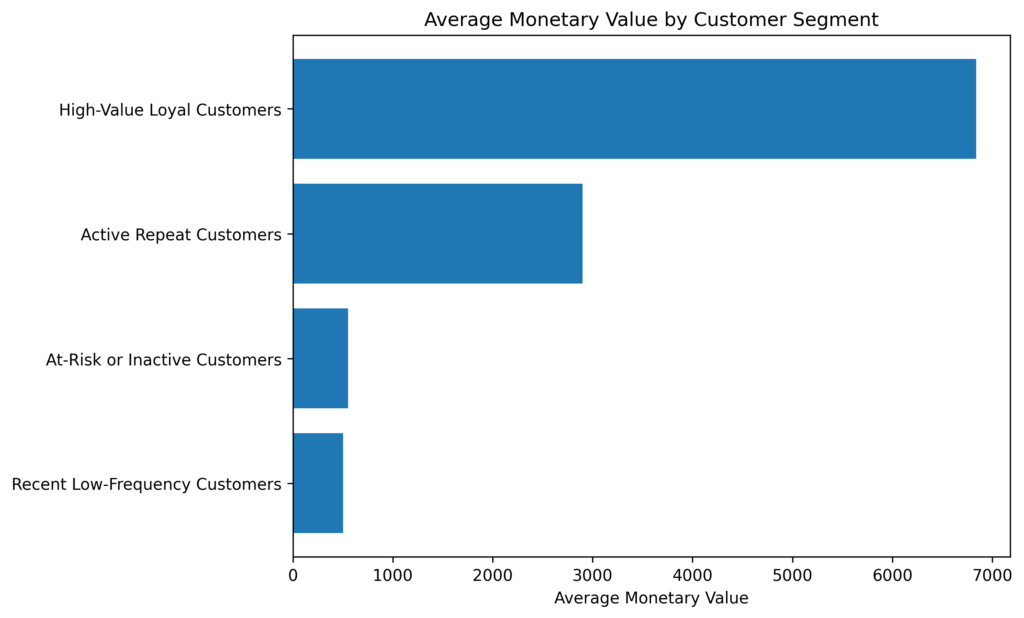
| High-Value Loyal Customers | 677 | 4.3 days | 11.87 orders | £6,837.96 |
| Active Repeat Customers | 986 | 44.8 days | 6.17 orders | £2,900.37 |
| Recent Low-Frequency Customers | 1,114 | 33.1 days | 1.75 orders | £504.36 |
| At-Risk or Inactive Customers | 1,561 | 200.6 days | 1.58 orders | £551.24 |
Figure 3. Customer Segment Sizes
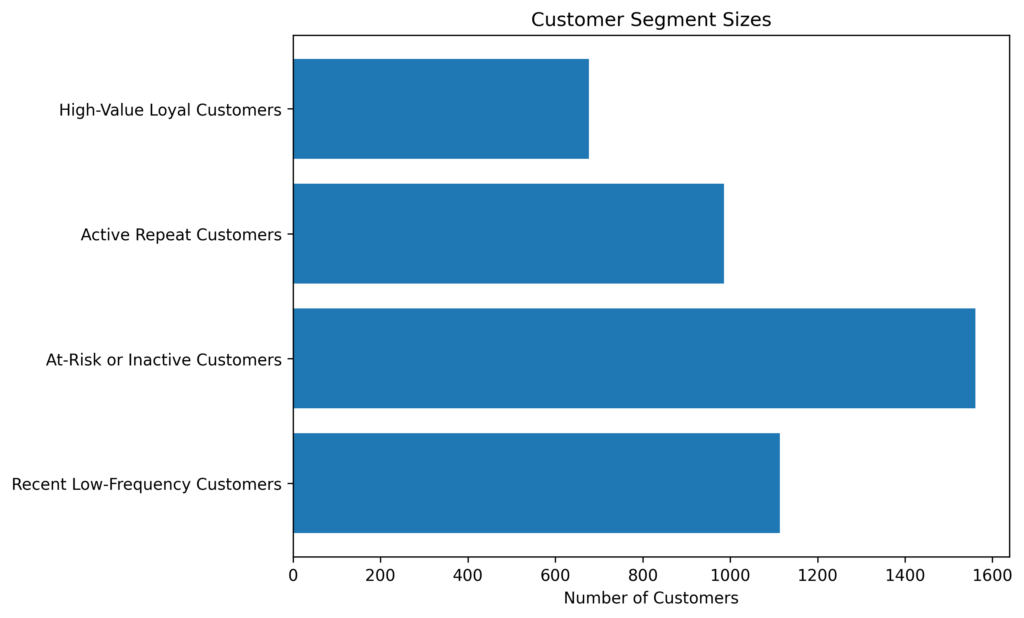
The at-risk or inactive group was the largest customer segment, while high-value loyal customers formed the smallest but most valuable group.
Interpreting the Customer Segments
High-Value Loyal Customers
These customers purchased approximately four days before the end of the analysis period, placed nearly 12 orders on average, and generated the highest average revenue.
Although this was the smallest group, it represented the retailer’s strongest customer relationships. These customers should be prioritized for retention because losing even a small portion of them could lead to a decline in revenue.
Appropriate strategies could include loyalty rewards, early access to products, personalized recommendations, and exclusive promotions.
Active Repeat Customers
These customers purchased less recently and spent less than the high-value group, but they still demonstrated strong repeat purchasing behavior.
They represent an opportunity for further growth through cross-selling, product bundles, loyalty milestones, and personalized recommendations designed to increase average order value.
Recent Low-Frequency Customers
These customers purchased relatively recently but completed fewer than two orders on average.
They may include new customers who have not yet developed an established relationship with the retailer. Timely follow-up communication, product recommendations, or second-purchase incentives could help convert them into repeat buyers.
At-Risk or Inactive Customers
Customers in this group had gone approximately 201 days without purchasing and placed fewer than two orders on average.
This was the largest segment, indicating that many customers had not returned for an extended period. Reactivation campaigns may recover some of these customers, although the expected value of each customer should be considered before offering large discounts.
Comparing Customer Value Across Segments
The greatest difference among the segments was monetary value. High-value loyal customers generated more than twice the average revenue of active repeat customers and more than ten times the average revenue of the two low-frequency groups.
Figure 4. Average Monetary Value by Customer Segment
Business Recommendations
The segmentation results suggest that marketing strategies should differ across customer groups.
Protect high-value loyal customers.
Provide loyalty rewards, exclusive access, and personalized communication to maintain these valuable relationships.
Develop active repeat customers.
Encourage more purchases with personalized offers and product recommendations.
Encourage a second purchase.
Target recent low-frequency customers with timely follow-up offers, onboarding messages, and recommendations based on their first purchase.
Bring back inactive customers.
Approach at-risk customers with reminder emails or carefully designed incentives, while considering whether the potential return justifies the cost of bringing them back.
Key Takeaways
This project showed that customer behavior within the same retail business varied substantially.
A small group of loyal customers generated exceptionally high value, while the largest segment consisted of customers who had not purchased for several months. RFM analysis and clustering transformed raw transaction records into customer groups that could support more focused retention, growth, and re-engagement strategies.
Code Highlights
I won’t paste 600+ lines of code here, but here are some excerpts showing important stages of the workflow.
Loading Packages
library(dplyr)
library(ggplot2)
library(lubridate)
library(cluster)
library(tidyr)
library(scales)
Importing and Cleaning the Data
business <- read.csv("bussiness.csv",
                     stringsAsFactors = FALSE)

business <- business %>%
  mutate(
    InvoiceDate = mdy_hm(InvoiceDate),
    Revenue = Quantity * UnitPrice,
    Cancelled = grepl("^C", InvoiceNo)
  ) %>%
  filter(
    !is.na(CustomerID),
    Quantity > 0,
    UnitPrice > 0,
    !Cancelled
  )
Creating Monthly Sales Summaries
monthly_sales <- business %>%
  mutate(Month = floor_date(InvoiceDate, "month")) %>%
  group_by(Month) %>%
  summarise(
    Orders = n_distinct(InvoiceNo),
    Revenue = sum(Revenue)
  )
Building the RFM Table
analysis_date <- max(business$InvoiceDate)

rfm <- business %>%
  group_by(CustomerID) %>%
  summarise(
    Recency = as.numeric(
      analysis_date - max(InvoiceDate)
    ),
    Frequency = n_distinct(InvoiceNo),
    Monetary = sum(Revenue),
    .groups = "drop"
  )
Transforming and Scaling the Data
rfm <- rfm %>%
mutate(
Recency = log1p(Recency),
Frequency = log1p(Frequency),
Monetary = log1p(Monetary)
)
rfm_scaled <- scale(
rfm[, c(“Recency”,
“Frequency”,
“Monetary”)]
)
Performing K-Means Clustering
set.seed(2026)
kmeans_model <- kmeans(
rfm_scaled,
centers = 4,
nstart = 50
)
rfm$Cluster <- factor(kmeans_model$cluster)
Profiling Customer Segments
segment_summary <- rfm %>%
group_by(Cluster) %>%
summarise(
Customers = n(),
AvgRecency = mean(Recency),
AvgFrequency = mean(Frequency),
AvgMonetary = mean(Monetary)
)
Creating Visualizations
ggplot(monthly_sales,
aes(Month, Revenue)) +
geom_col() +
labs(
title = “Monthly Revenue”,
y = “Revenue (£)”
) +
theme_minimal()
Leave a Reply